 My freshman have been learning about speed, velocity and displacement. I’ve also been trying help them brush up on their unit conversion skills. It’s tough because you run out of real-life examples. I can only do so many labs with toy cars.
To drive home the lesson, I had students use Google Maps to map out different bus routes in our area. Students were paired up and assigned a route. With help from our local transit system’s website, each pair had to:
- map out the route with a line (this gave them the route’s distance)
- find the average time needed for the bus to make a complete loop
- calculate the average speed of the bus
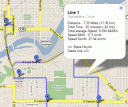
- display the results on the map
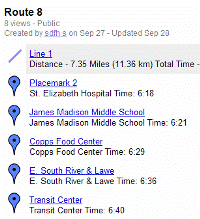
 Students with extra time could earn more points if they placed a pin at each stop and entered the arrival times in each stop’s description. They could also calculate the average speed from stop-to-stop.
The project was a success and the students seemed to enjoy it. The class was a full of discussions about things like: which bus goes by which landmark or which bus is always late. One group even brought in a paper map to use as a guide. It was fun to watch the students work.
All the maps were shared using the embed tags and students could see all the routes on one big map. The project made my lesson plan for the following week much simpler since I now established an example that everyone had an understanding of.
Here is an example map.
 RSS - Posts
Hello,
I teach 8th grade physical science and think your work with your students is amazing. I know if I could introduce this lesson in my class, our high school teacher would love me!!! I hate sending unprepared students to high school with little prior knowledge. Kudos to you!!!
Jackie
Thank you thank you for sharing this awesome idea! I have been trying to find ways to incorporate more features like these into my lessons. I am excited to try something like this with my students.